Signed in as:
filler@godaddy.com

The original setup.
Started with me being curious about a few (seemingly) basic questions, such as:
The interface is written using Python Curses library which runs straight from

Initially, two raspberry pi's are used, one for the display and the other for sending sensor readings each time a message is received over a tcp/ip socket.
Seasoned hobbyists might notice the amateur mistake in this picture (hint: heat).
Adafruit Si7021 (temp, humidity) and TSL 2561 (vis/ir light) sensor boards communicate serially through the default I2C pins on Pi #2. Did not own a soldering iron

The characters and numbers are simple ascii art that I collected from the web. The python code loads them from file and stores them as lists of lists. Each character must take up the same number of lines for the output to be rendered correctly. Curses library arranges the the corresponding indexes of the lists for each line and character I want to print.
One step closer to portability. Still the same setup except now Pi #1 has a portable display.
This is a standard 3.5" resistive TFT touchscreen that you can buy from any number of vendors.
Improvements needed:
Replaced the second Pi, now sensing and displaying are done on the same device. The portrait orientation seemed easier for a hand-held form factor.
Added battery and velcro'd Raspberry Pi to it. The sensors are only connected and held up by 22AWG wire using one of the vertical rails from a half bread board. They are mounted away from the heat of the Pi to get accurate readings. Since I did not own a soldering iron I just looped the wires around the sensor boards' pin-holes, which sometimes made it disconnect. Sensors are connected to the Pi's standard I2C pins. The video shows me testing the sensor readings when I put them directly in front of the AC duct.

Replaced the second Pi, now sensing and displaying are done on the same device. This image shows a BMP388 peeking out behind the Pi. It did however make the design a bit clunky since the display would no longer sit perfectly flush with the Pi. .
I learned a lot of matplotlib for research (visualizing results, writing papers, etc) so I decided to use it for visualizing live data. Pictured here is me using matplotlib for live plotting live data from the pressure sensor (it also measures temperature)..
Added: CQRobot BMP388 barometric pressure sensor
Curses library was a good start but it was still really a CLI hacked into displaying large characters and plots. Finally learned pygame - a game development library for python, which can also be used to create other GUI applications as well.
Once I got the hang of it, I combined it with both custom-written and matplotlib visualizations. Also experimented with buttons in the interface, which were just png's I exported from power point (one for pressed and one for unpressed. This video shows me testing skeuomorphic buttons, although I did not end up using them. Researched some LCARS interfaces.
The plot and the vumeter both show the sound intensity in decibels. it can be seen responding fairly quickly to the music being played. All of the sensing and visualizing currently displays 5.5 frames per second. Not too bad for a high level language like python running on an SBC.
Added Sensor: Adafruit electret mic with auto gain
Tried the Kivy python library and it had some great UI options.
Unfortunately it was too slow on the Pi. Returned to using Pygame which is a lot more low level and thus faster. The trade off being the effort of programming.

Now that I know what the device should look like and how it should work, it is time to add as many sensors as I can gather. Some of the new ones are labelled in the image.

Screen dies in a soldering accident. Soon afterwards, the analog to digital convertor and FT232H are also lost in the line of duty. This image is from some days before they were lost.
Right before the screen died, I was able to acquire a soldering iron (which is actually how the screen died). Bought some male header pins and some Adafruit stackable HATs, which gave the design some much needed rigidity. The stack of HATs is now plugged in to the Pi using a right angle 40-pin GPIO extender. This seemed like the best choice since the FT232H was also dead.
Chip shortage meant HyperPixel 4.0 Square was the only display in stock. Initially I would have preferred the smaller rectangular HyperPixel, or another 3.5" TFT. However, after experiencing the large crisp display, there is no going back.
Also bought Adafruit stacking HATs and soldered the sensors on them. These made the device a lot more rigid. Currently they are only using the pHAT stack pins to hold them in place using a dummy HAT attached at the rear with right angle headers (i.e., no electrical connection). The FT232H is being used to read sensor data, but it too died shortly (heh).
The pHAT stack allows massive expansion with 5 parallel 40-pin GPIOs. If not for the chip (and everything else) shortage, I would probably have gone with the smaller version.
The pi is mounted on the back side (facing down) with nylon screws. It connects to the pHAT stack using the black ribbon cable seen in the bottom of the video. For some time I had attached a fan to the underside to prevent possible over heating but it wasn't really needed.

A close up of the stacked HATs.
Front layer: vis/r, uv, and spectrometer
Middle layer: temp/humid, barometric pressure, VOC/eCO2, neopixel strip.
Back layer: thermal camera (not soldered), electret mic, wind speed sensor, and ADC/DAC.
A raspberry pi zero is connected behind the sensors which now sends data over bluetooth (the FT232H died).
Neopixels making a cool Cylon effect. The blue glow at the bottom is from a cooling fan's LED shining on a clear acrylic separator.

Using a Raspberry Pi Zero W to read sensor information fro the stack of HATs. Sent over bluetooth to second Pi with display. Added battery/power management hardware and software defined radio.
A demo using the two Pi setup.
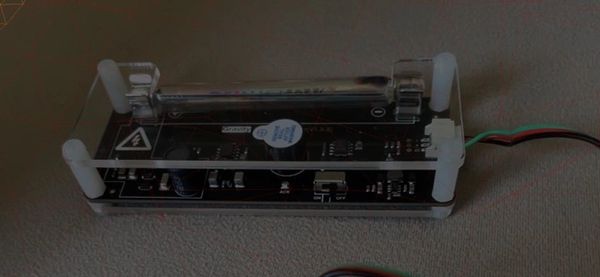
Replaced the second pi with a microcontroller. Saves power, weight, and allows for faster readings. This is especially useful for using the LiDAR as a speed gun.
This video is me testing the microcontroller and power circuitry connected while to a 2500mAh LiPo battery. Data from the current and battery level sensors are displayed on the OLEDs. The voltage readings from both match up very closely.
The soldered pins are for testing the capacitive touch pads. The whole assembly is on stacked bakelite boards. The other sensors (not shown here) are connected through the long cable (stemmaQT connecter) for reading.
Testing the Geiger counter module from DFRobot.

Used Fritzing to design 4 PCBs.
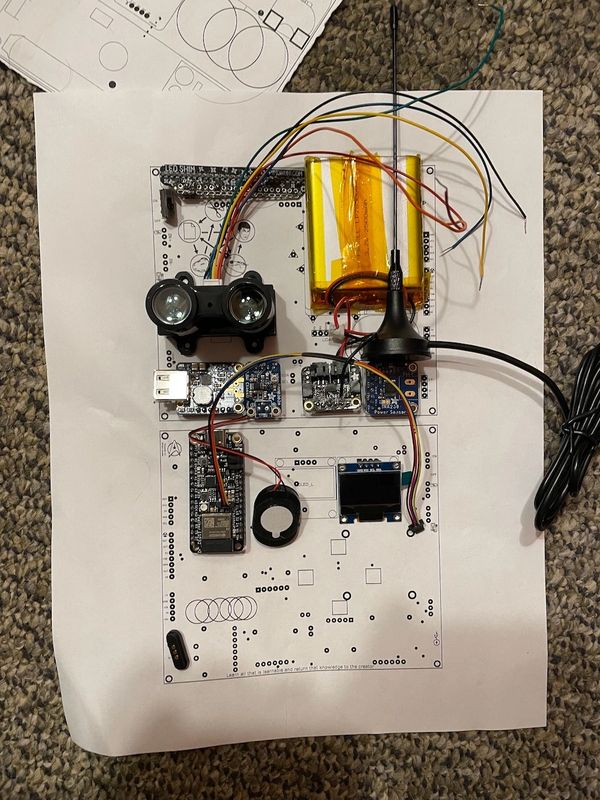
Low-tech way of making sure everything fits. Didn't know much CAD so I printed the svg files in 1:1 ratio to check. I did use tinkered a bit initially and now working with Fusion360 for the case.
Used spare cardboard to pin the circuit-printout and sensors to get a better idea of the size and 3D arrangement. Cat (named Lt. Cdr. Data) not part of circuit.
De-soldered all components from HATs and Bakelites. Running a complete test before I send my PCB order.
Working on object detection till the PCBs arrive.